Flow cytometry is a foundational technology in modern cell biology, immunology, and translational research. It enables rapid, quantitative measurement of physical and molecular properties of individual cells suspended in fluid. While experienced users rely on it daily, newcomers often encounter a steep learning curve because the technology combines fluid dynamics, optics, electronics, and biological interpretation.
At its core, however, flow cytometry follows a simple and elegant principle: cells pass single-file through a laser beam, and the light they scatter and emit is measured to reveal biologically meaningful information. Understanding how this process works and how signals become interpretable data, removes much of the mystery surrounding the instrument.
This technical note introduces the essential systems, signals, and analysis concepts behind flow cytometry. Rather than focusing on advanced applications, the goal is to build a practical mental framework that beginners can use to design experiments, recognize good data, and troubleshoot common problems.
The defining strength of flow cytometry is single-cell resolution. Cells are suspended in liquid and introduced into the instrument, where they are organized into a narrow stream. As each cell passes through the interrogation point, it generates discrete optical signals that are recorded as individual events.
This event-based measurement provides several advantages:
Unlike imaging approaches that provide visual morphology, flow cytometry translates optical properties into numerical data. Each event corresponds to a single particle, and each parameter measured represents a defined physical or molecular characteristic.
Patterns observed in plots reflect the biological distribution of cells within the sample. Clusters, gradients, and population spreads emerge from underlying biology — as well as from technical variables such as staining efficiency and instrument configuration. Maintaining data integrity therefore depends on careful experimental design and instrument optimization.
Flow cytometry relies on the coordinated function of three integrated subsystems: fluidics, optics, and electronics. Each contributes directly to measurement accuracy and resolution.
The fluidics system governs how cells move through the instrument. A cell suspension is injected into a flowing sheath fluid. Because the flow is laminar, the sheath fluid compresses the sample stream through hydrodynamic focusing, aligning cells into single file before they intersect the laser beam.
This precise alignment ensures that each optical signal corresponds to a single cell. Disruptions in flow stability — due to clumping, excessive debris, or inappropriate concentration — compromise data accuracy and may introduce coincident events.
Sample preparation directly affects fluidic performance. Key considerations include:
Flow rate also influences resolution. Higher flow rates increase acquisition speed but may reduce signal separation. Lower flow rates improve measurement precision, particularly when resolving dim fluorescence or closely spaced populations.
Fluidics establish the physical foundation upon which all subsequent measurements depend.
The optical system transforms biological properties into measurable light signals. One or more lasers illuminate cells at the interrogation point. When light interacts with a cell, it is scattered or absorbed and re-emitted by fluorescent molecules.
Scatter signals provide structural information:
These measurements are influenced by cell morphology, refractive index, and optical configuration. While scatter is not a direct measure of size or granule count, it provides reliable relative comparisons within a given experiment.
Fluorescence signals arise from labeled antibodies or probes that bind specific molecular targets. Upon excitation, fluorophores emit light at characteristic wavelengths. Optical filters and dichroic mirrors direct defined wavelength bands to appropriate detectors.
Because many fluorophores exhibit overlapping emission spectra, signal separation requires careful optical design and post-acquisition correction. The number of lasers and detectors determines the dimensionality of measurable parameters.
Optical configuration influences sensitivity, resolution, and dynamic range. Alignment and calibration are therefore critical for consistent performance.
Once optical signals are collected, photodetectors convert photons into electrical pulses. These pulses are amplified, digitized, and recorded as numerical values representing signal intensity.
Detector settings, often referred to as gain or voltage, determine how signals are scaled within the instrument’s dynamic range. Improper scaling can compress populations or exaggerate noise, affecting interpretability.
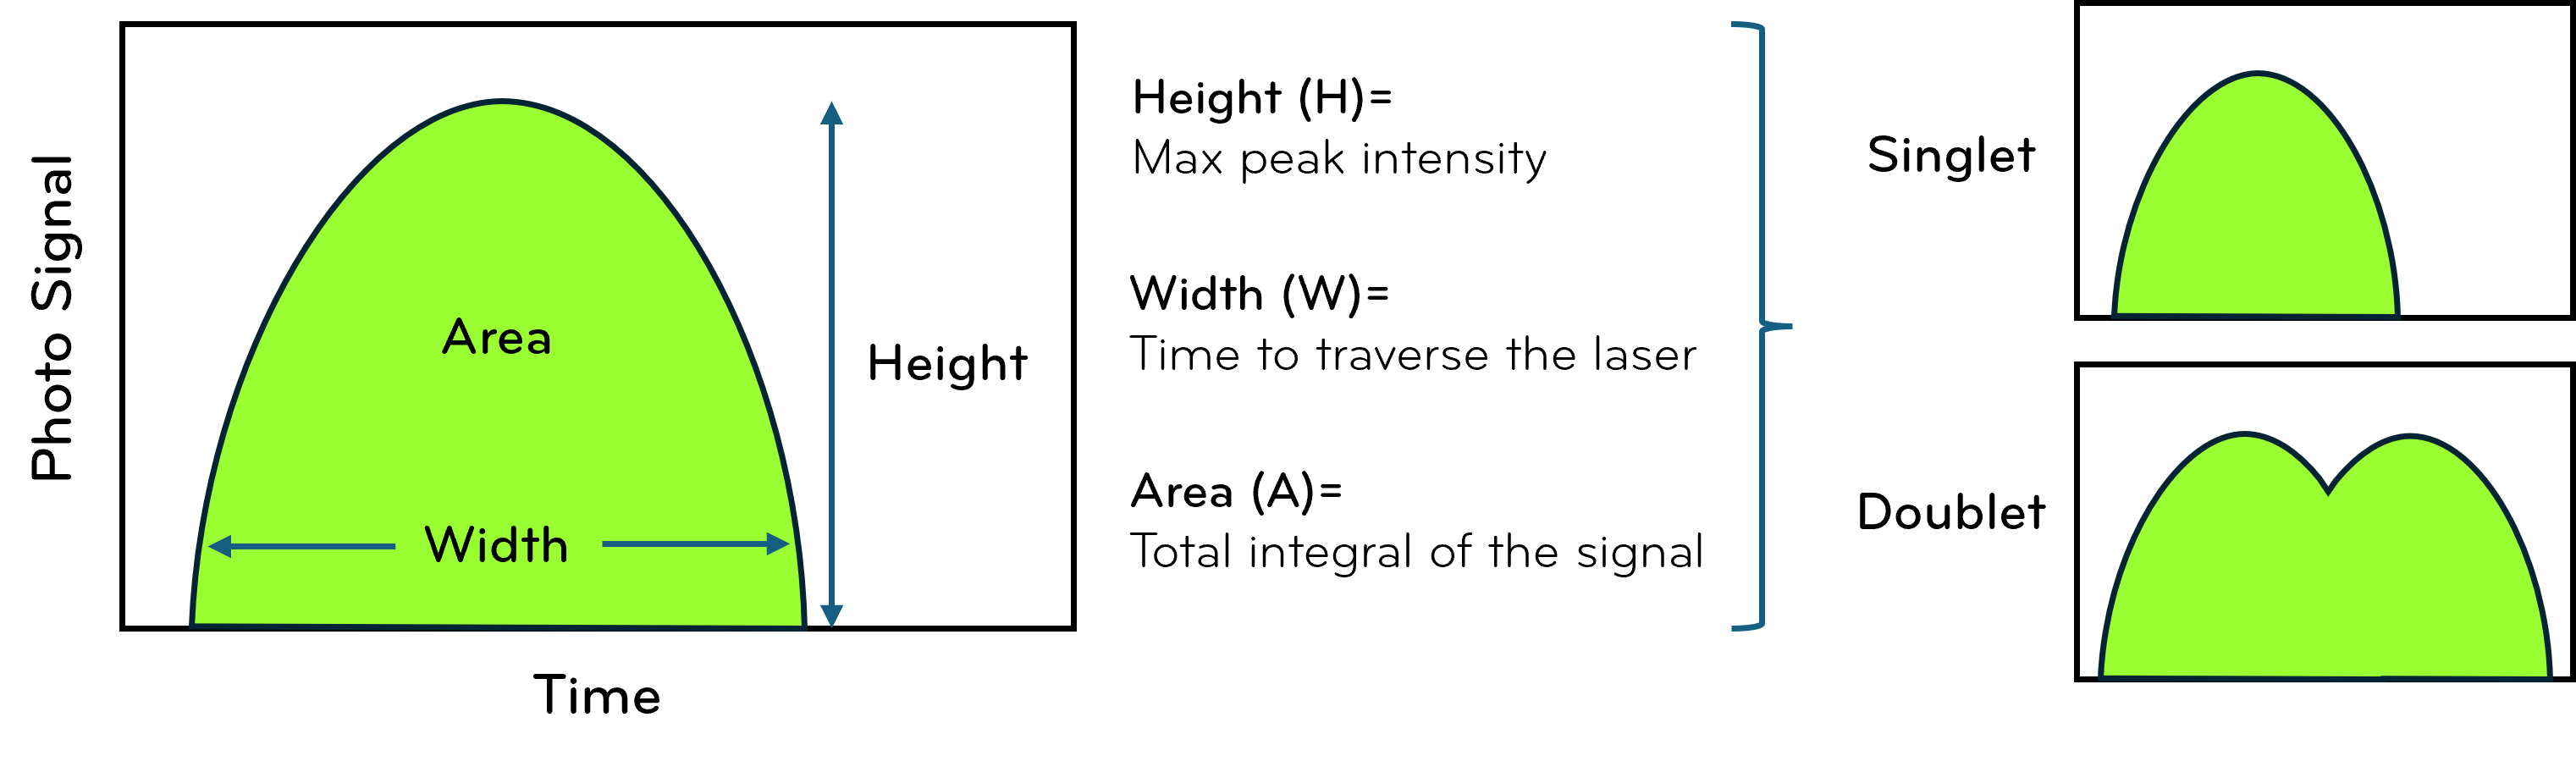
Modern instruments incorporate high-speed digital electronics capable of capturing subtle differences across wide signal ranges. Signal processing includes pulse height, area, and width measurements, enabling discrimination between single cells and aggregates.
Because flow cytometry is inherently quantitative, instrument configuration must align with experimental goals. Electronic precision ensures that biological differences are faithfully represented in the data.
Fig. 1. Internal Components of a Flow Cytometer
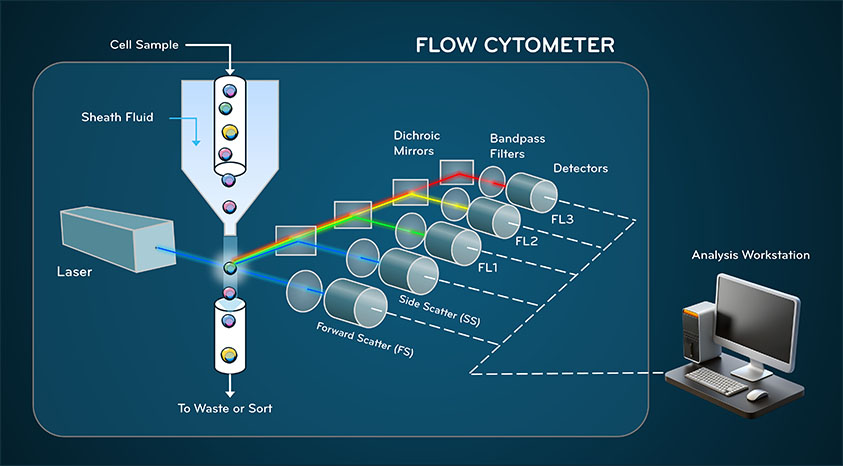
Fig. 2. Electronic signal processing and the discrimination of doublets
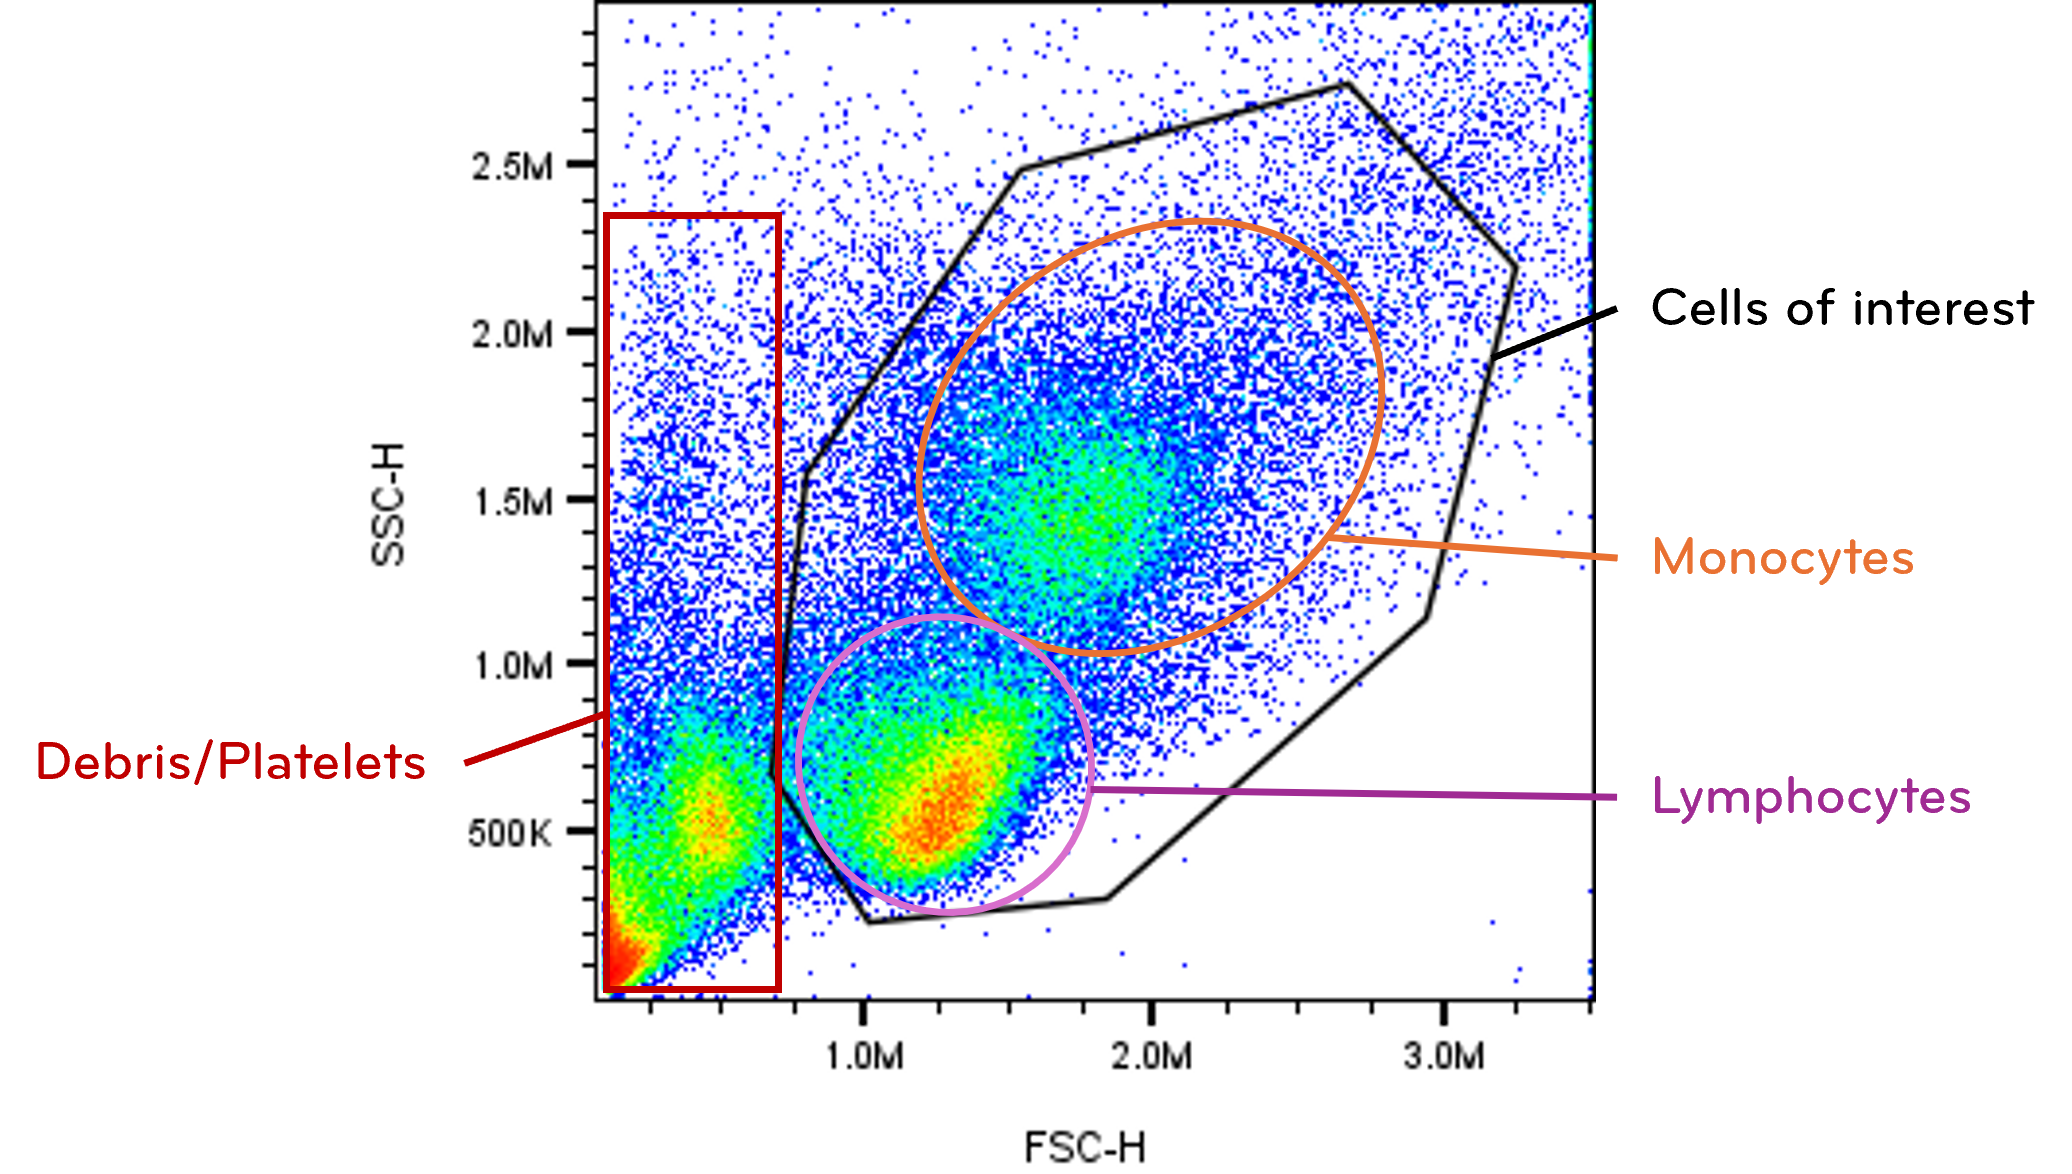
Scatter measurements provide the structural framework for analysis. An FSC versus SSC plot typically reveals distinct clusters corresponding to major cell types, debris, or dead cells.
This structural map enables exclusion of irrelevant events before analyzing fluorescence data. Removing debris and noncellular particles improves downstream clarity and statistical accuracy. Although scatter correlates with physical properties, it is influenced by instrument configuration and optical alignment. Interpretation should therefore focus on relative comparisons within experiments rather than absolute size determination. Establishing a clean scatter gate enhances the reliability of all subsequent analyses.
Fig. 3. Forward scatter (FSC) and side scatter (SSC) gating
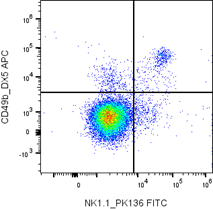
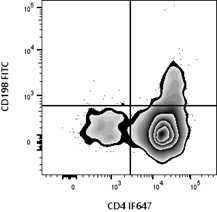
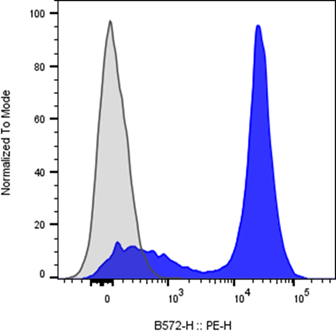
Fluorescence detection enables identification and quantification of specific cellular markers. Fluorescently conjugated antibodies bind defined antigens, and emitted light intensity reflects relative expression levels.
Signal intensity is influenced by:
Biological populations often exhibit continuous distributions rather than discrete positive and negative clusters. Careful control design is required to define thresholds and interpret expression patterns accurately.
Fluorophore selection is critical in multiparameter experiments. Bright fluorophores are typically assigned to low-density markers, while dimmer fluorophores are reserved for highly expressed targets. Spectral overlap must be considered to minimize signal spreading and preserve resolution.
Fluorescence transforms flow cytometry from structural analysis into high-dimensional molecular profiling.
Fig. 4. Fluorescence signals from antibody-fluorophore conjugate binding
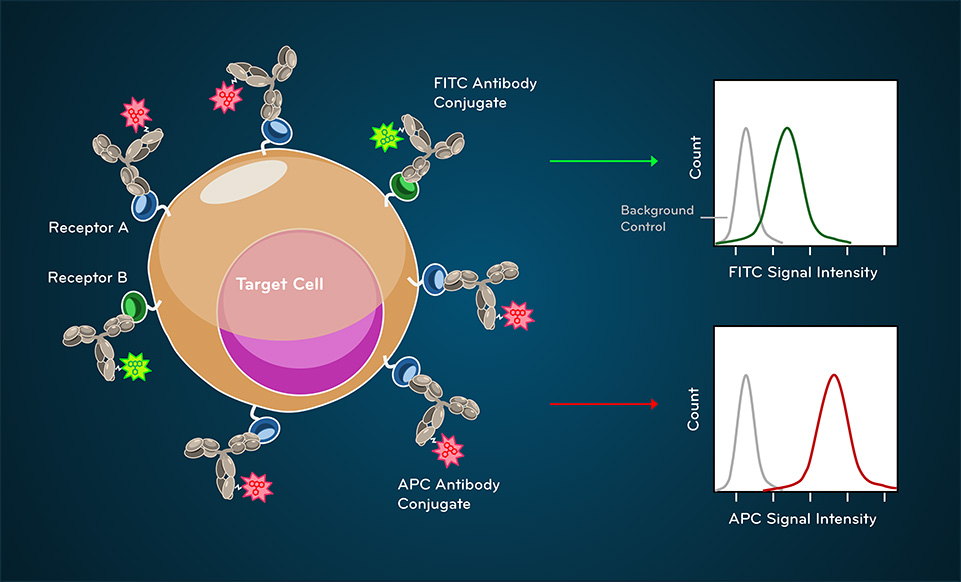
An important takeaway is that fluorescence intensity reflects relative measurement, not absolute molecular counts. Controls are essential for interpreting what constitutes positive versus negative signal.
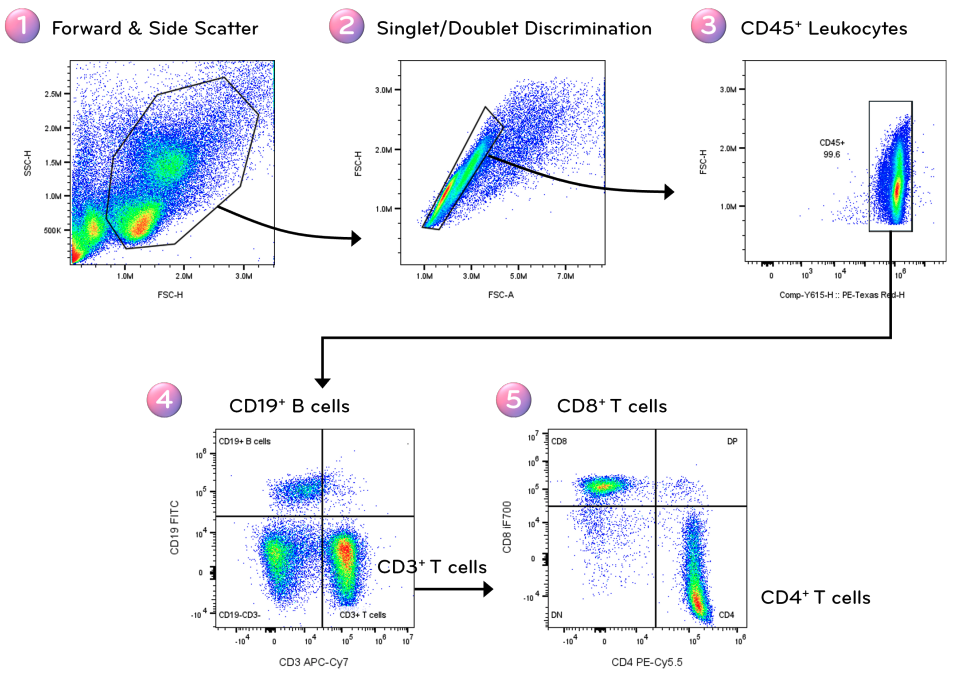
Gating defines subsets of events based on measured parameters. A logical gating strategy progressively refines the dataset to isolate populations of interest.
A typical workflow may include:
Each gate should be justified biologically and applied consistently across samples. Overly aggressive gating risks bias, while insufficient refinement introduces noise.
Structured gating enhances reproducibility and ensures that quantitative comparisons reflect equivalent cellular subsets.
Fig. 5. Stepwise gating workflow for identification of B and T cells
Controls provide reference points that anchor interpretation.
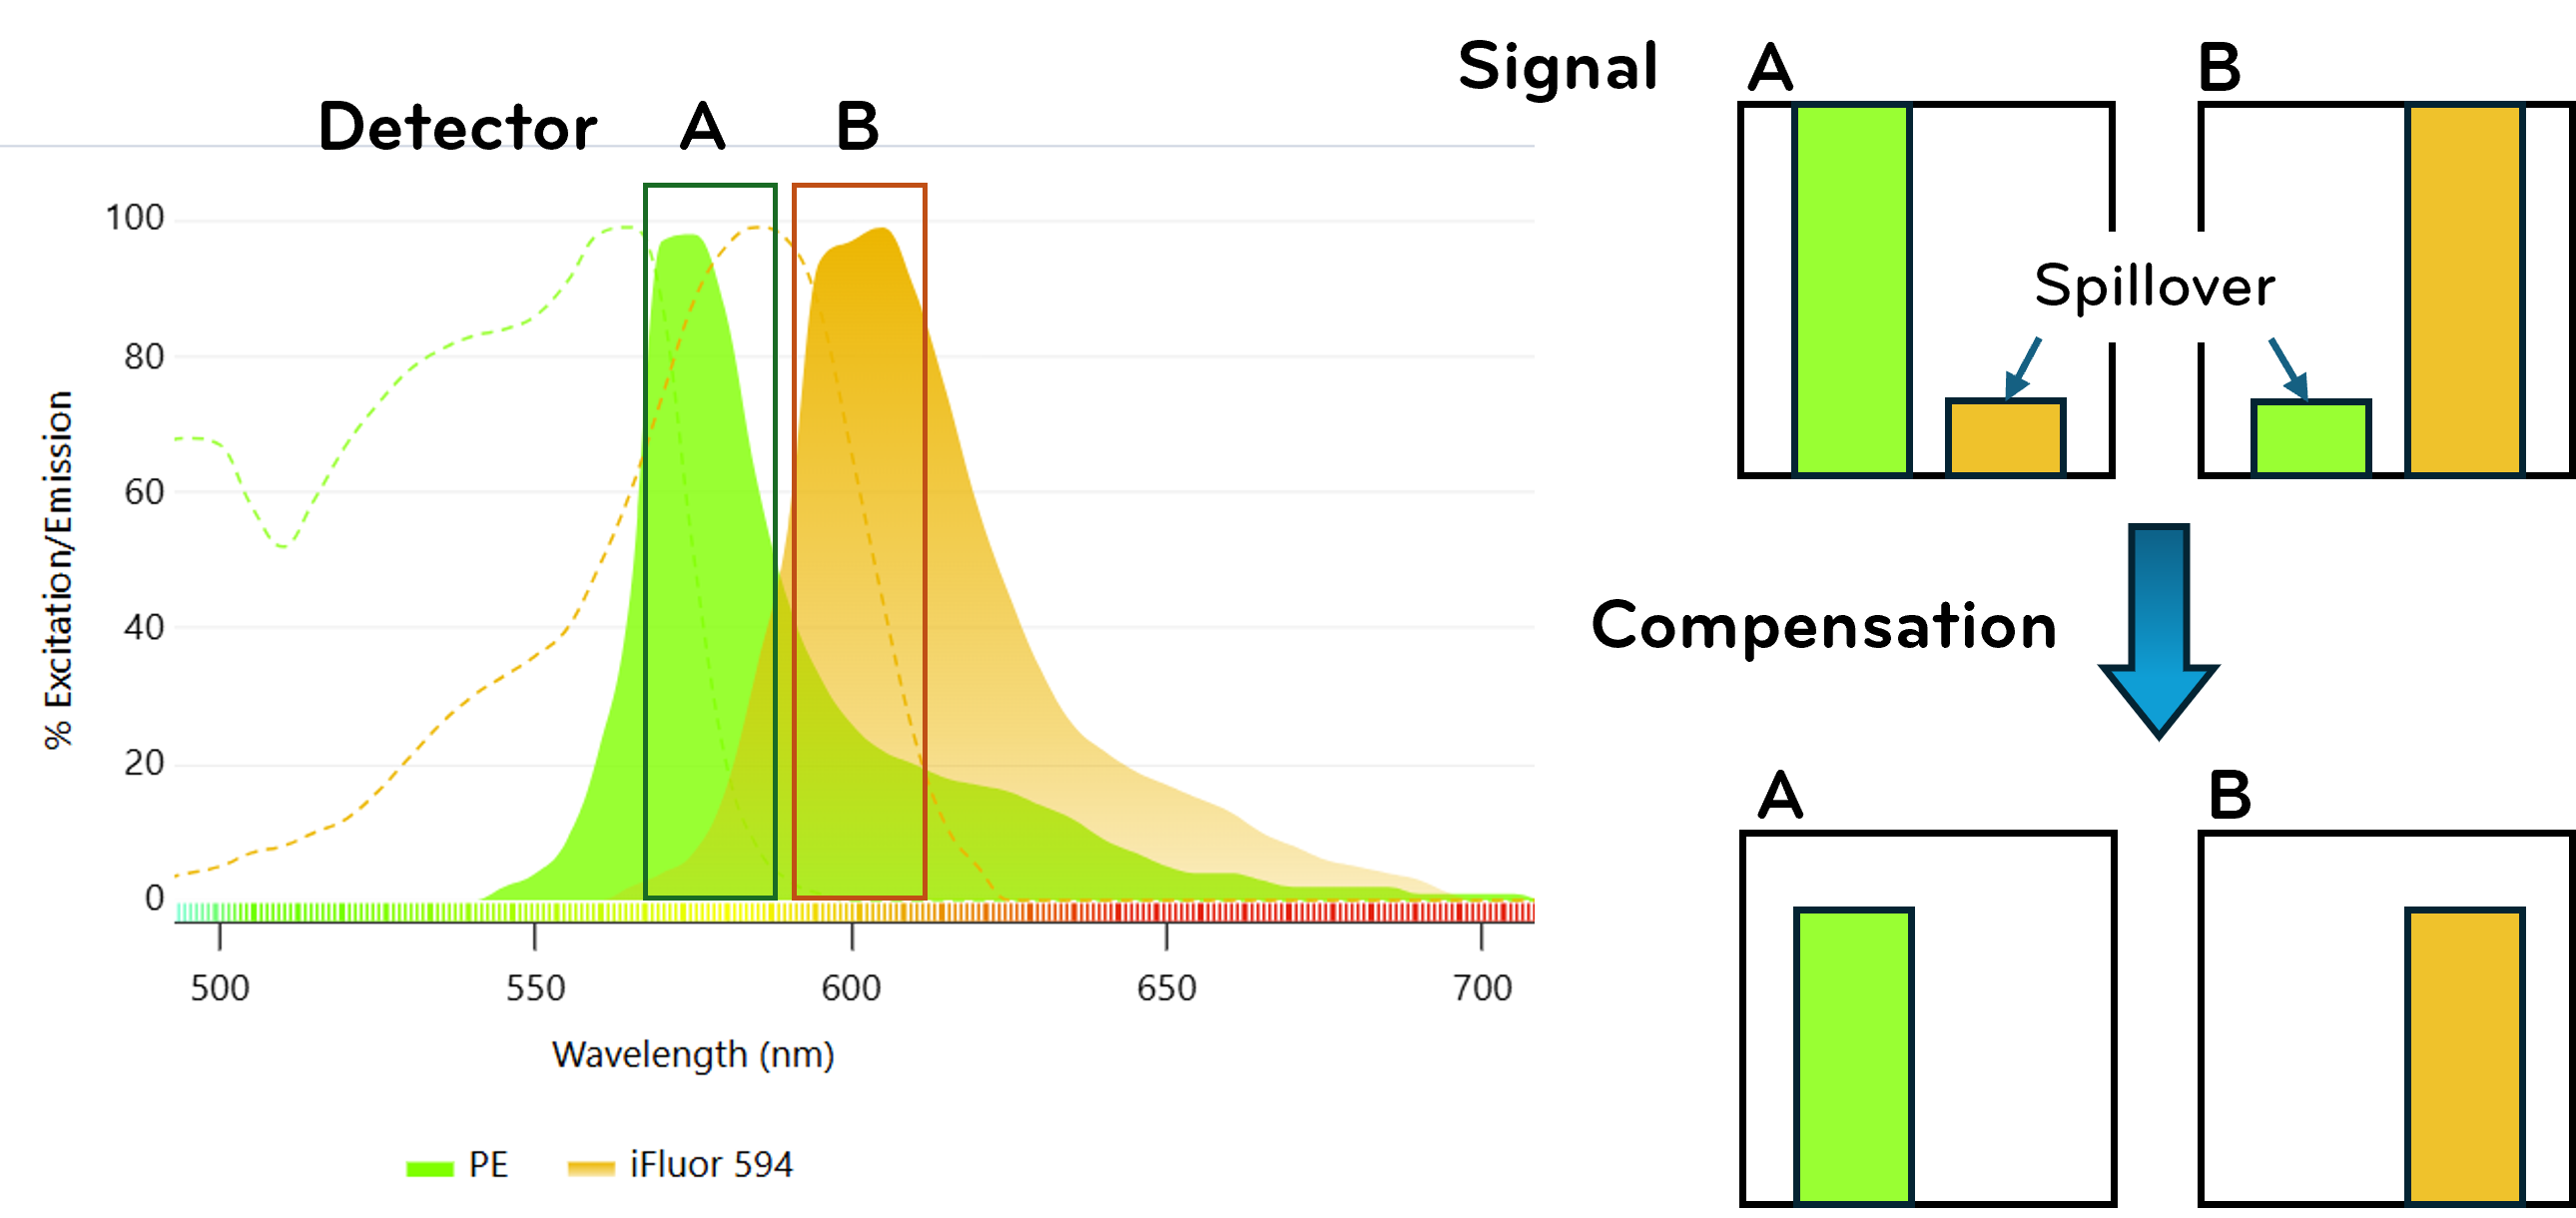
In multicolor experiments, spectral overlap between fluorophores requires compensation to mathematically subtract spillover. Accurate single-color controls as well as FMO controls are essential for proper correction and gating. Controls transform fluorescence intensities into meaningful biological conclusions. Without them, distinguishing true signal from artifact becomes unreliable.
Fig. 6. Spectral overlap and compensation
Flow cytometry data are visualized through plots that reveal population structure and signal distribution.
Understanding how scaling, gating, and visualization affect interpretation is key. Logarithmic scaling is commonly used to accommodate wide signal ranges, while linear scaling suits scatter parameters.
Quantitative outputs may include:
Reproducibility depends on consistent gating, stable instrument settings, and standardized controls.
Flow cytometry integrates fluid dynamics, laser excitation, fluorescence chemistry, and digital signal processing into a cohesive analytical platform. Each subsystem influences data quality, and each experimental decision — from sample preparation to fluorophore selection — shapes interpretability.
A solid understanding of:
This provides the framework necessary for rigorous experimental design.
When these principles are applied consistently, flow cytometry becomes a precise, high-throughput method for interrogating cellular biology at single-cell resolution.
Contact us for expert support.